NBA data in spreadsheets for historical seasons and current season. You can filter by data type or by season and view sample files to see what columns are included in each dataset.
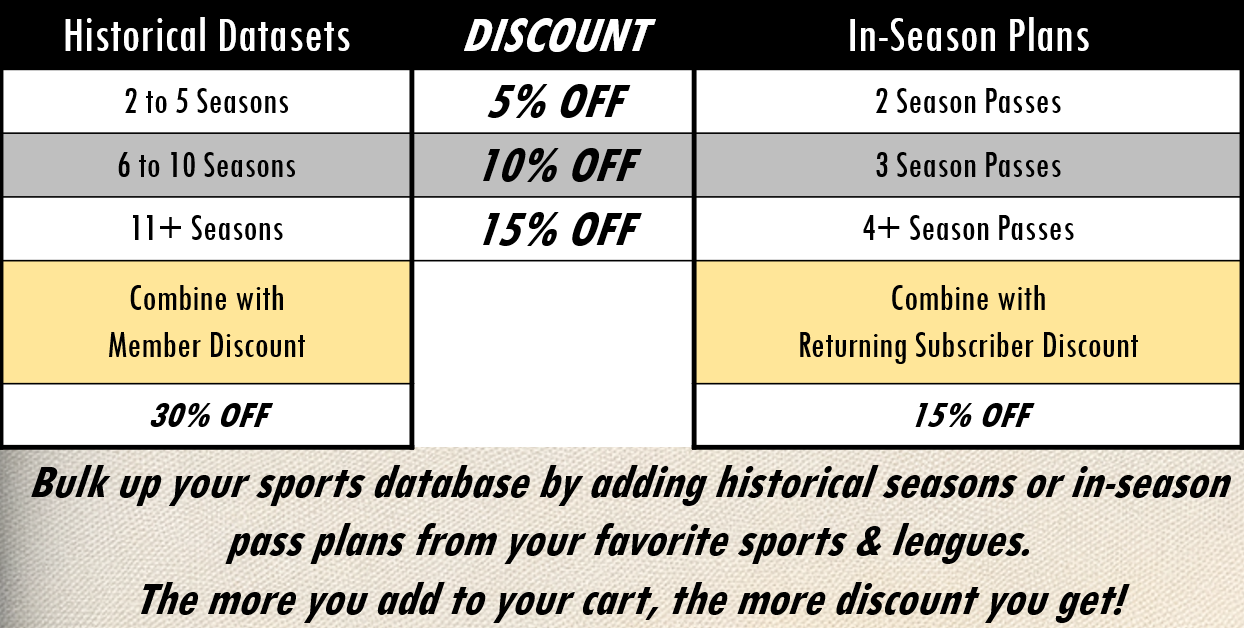
Discounts for Historical Datasets
(1) BULK PURCHASE DISCOUNT: You get a bigger discount as you add more seasons to your cart.
• 2 to 5 seasons → 5% OFF
• 6 to 10 seasons → 10% OFF
• 11 seasons and more → %15 OFF
(2) MEMBER DISCOUNT: You just need to log in, or sign up for a free BigDataBall account to get your 30% member discount on historical datasets in addition to the bulk purchase discount.
Discounts for Season Pass Plans
(1) BUNDLE PURCHASE DISCOUNT: You get a bigger discount as you add more season passes to your cart.
• 2 season passes → 5% OFF
• 3 season passes → 10% OFF
• 4 season passes and more → %15 OFF
(2) SUBSCRIBER DISCOUNT: If you have previously purchased a “season pass” from any sports, get 15% subscriber discount in addition to the bundle purchase discount.
NBA Dataset in Excel Spreadsheets
How NBA Data Works & Who It Is For
BigDataBall is your one-stop-shop for data & insights on the NBA. Cleaning, enriching, and organizing all the noisy data collected across many sources are on us so, you can spend your time doing what you do best: Analyzing NBA data in your own way.
With BigDataBall, it is not anymore laborious for you to find anything from NBA stats, schedules, players, and daily fantasy DFS salaries to NBA play-by-play data which 100% validated and trusted by a loyal base of league offices, bettors/fantasy players, data journalists, and academic researchers.
What You Can Do With NBA Datasets
Whether you choose to work in Google Sheets or R (R is the most widely accepted of our users’ analysis and visualization tools), getting started with our data is a breeze. It can be analyzed in a number of ways to shed light on basketball’s players and games. With the NBA datasets that is given, you can do different analyses and get useful information about team performance, player contributions, game dynamics, and other things.
1. GAME-ID: An identifier for the game.
2. Season: The season to which the data belongs.
3. Game Date: The date of the game.
4. Away Team's Five-Men Lineup (Players On The Court) 1-5: The players on the court for the away team (in five-man lineups) during the event.
5. Home Team's Five-Men Lineup (Players On The Court) 1-5: The players on the court for the home team (in five-man lineups) during the event.
6. Period: The period of the game in which the event occurred.
7. Accumulated score of the away team: The total score accumulated by the away team at that moment in the game.
8. Accumulated score of the home team: The total score accumulated by the home team at that moment in the game.
9. Remaining time in the period: The time remaining in the period when the event occurred.
10. Time passed since the period has started: The duration of the game that has passed since the start of the period.
11. Duration of the event: The duration of the specific event described in that row.
12. Event ID: An identifier for the event.
13. Team executing the event: The team that executed the described event.
14. Various types of events: Different types of events such as fouls, free throws, turnovers, etc.
15. Player who made the assist: The player who assisted in the event if it is an assisted field goal.
16. Player of the away team participating in a jump ball.
17. Player of the home team participating in a jump ball.
18. Player who blocked a shot.
19. Player who checks into the game.
20. Player who checks out of the game.
21. Free throws in order (first, second, third...).
22. Player who drew a foul.
23. Number of free throws to be shot.
24. Player who made the event happen.
25. Points scored within the event.
26. Player who grabbed the ball after the event.
27. More details on how the event happened.
28. Shot made or missed.
29. Player who stole the ball.
30. Various types of events that occur in a game.
31. Shot distance (in feet).
32. X-axis value of the shot.
33. Y-axis value of the shot.
34. X-axis value converted to X coordinate on an NBA court (94 feet long and 50 feet wide).
35. Y-axis value converted to Y coordinate on an NBA court (94 feet long and 50 feet wide).
36. Description of the play.
With a dataset that includes the columns above, you can analyze and extract valuable insights about NBA player & team performance, understand coaching strategies, game dynamics, and much more.
- Trends and patterns in scoring: Look at the total scores of both the away and home teams over time to find things like which periods or game stages had the most points. This can help find out how good or bad a team’s offense is.
- Lineup effectiveness: Look at how both the away and home teams’ different five-man groups did. Use different data, such as points scored, points allowed, field goal percentage, and plus/minus, to figure out which lineups work best against certain opponents and which ones don’t.
- Player performance: Evaluate the performance of each player by looking at how they did in different events. Find out how many points each player scored, how many assists they gave, how many steals, blocks, mistakes, and how well they shot. Find out who the key players are and how they affect the game.
- Event analysis: Look more closely at specific events (like fouls, mistakes, and three-point shots) to find out how often, where, and what happens when they happen. You can find out what kinds of events happen most often and how they change the flow of the game.
- Play-by-play sequences Look at how things happen in order to find trends, runs, or changes in momentum during the game. For instance, you could look at scoring streaks, turnovers that led to fast breaks, or important plays that changed the result.
- Shot analysis: Use the shot distance, the number of made and missed shots, and the X and Y locations on the NBA court to figure out how well a player shoots and how they choose their shots. Calculate shooting percentages based on how far or where a shot was taken to find people or teams that are good at shooting from certain spots.
- Game dynamics: Look into how different things, like how much time is left in a period or how long an event lasts, affect how the game is played. Find out if teams tend to score more points or give up more points at certain times.
- Foul analysis: Look at the fouls that were drawn, the fouls that were made, and the free throws that were taken as a result. This will help you figure out how teams defend and how well players can draw fouls. Look into how fouls affect the result of the game and how certain players do.
- Assist Analysis: to find out if there is a link between players who give assists and players who score the most points. Find players with a high number of assists to points and look into how well assisted field goals work.
- Changing Players: Look into how changing players affects the game. Look at how the team does and how many points they score differently when people join or leave the game.
By doing these studies and looking at the different parts of the dataset, you can learn more about how teams play, how players interact, how points are scored, and other things that affect NBA games.
Incorporate NBA Betting Odds Data
You can provide additional context and help you make more educated predictions. Here’s how you can use your NBA betting odds data in conjunction with the player and play-by-play dataset:
1. Outcome prediction: Compare the betting odds for a particular game with the play-by-play data to identify any discrepancies or potential value bets. Analyze factors such as the pregame point spread, moneyline odds, or over/under totals, and assess how they align with the actual game results. This analysis can help you understand how odds reflect expectations and identify opportunities where the odds might not accurately reflect the teams’ performance.
2. Game analysis: Combine the play-by-play data with the betting odds to gain insights into game dynamics and potential betting strategies. For example, examine how teams perform against the point spread or analyze their record when favored or underdogs. This analysis can help you identify trends, such as teams that consistently cover the spread or exceed expectations, allowing you to make more informed betting decisions.
3. Player performance vs. Player props: Compare individual player performance in the play-by-play data with player-specific betting props, such as points scored, rebounds, assists, or other statistical categories. Assess if certain players consistently exceed or fall short of their betting prop numbers. This analysis can help you identify favorable or unfavorable betting opportunities based on players’ historical performance.
4. In-game betting: Use the play-by-play data and live betting odds to identify potential opportunities for in-game wagers. Analyze momentum shifts, scoring patterns, or individual player performances to make informed bets during the game. In-game betting allows you to leverage real-time information and adjust your strategy accordingly.
5. Correlations with odds: Explore correlations between specific events or game situations in the play-by-play data and the corresponding odds. For example, analyze how certain events (e.g., turnovers, fouls, fast breaks) affect the point spread or over/under totals. This analysis can help you uncover insights and potentially identify profitable betting strategies based on specific game scenarios.
6. Historical odds analysis: Combine historical betting odds with the play-by-play data to identify trends and patterns in the odds. Assess how betting markets react to specific team matchups, home-court advantage, or other factors. Analyzing historical odds can help you gain a deeper understanding of how bookmakers set their lines and identify opportunities where the odds might be mispriced.
Make sure you always conduct thorough analysis before making any decisions. Combining the play-by-play data with NBA betting odds can enhance your understanding of the game and potentially improve your betting outcomes.