NCAA basketball data in spreadsheets for historical seasons and current season. The college basketball datasets include data on all games played by DIV-I teams during the season.
You can filter by data type or by season and view sample files to see what columns are included in each dataset.
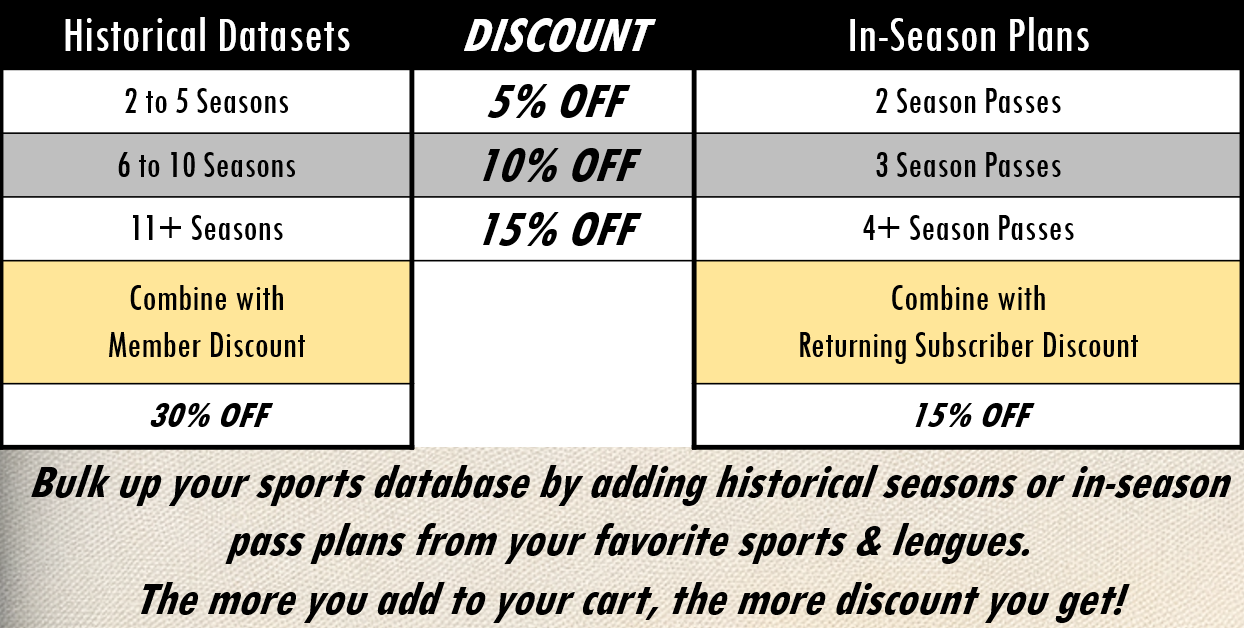
Discounts for Historical Datasets
(1) BULK PURCHASE DISCOUNT: Get a bigger discount as you add more historical seasons to your cart!
• 2 to 5 seasons → 5% OFF
• 6 to 10 seasons → 10% OFF
• 11 seasons and more → 15% OFF
(2) MEMBER DISCOUNT: Get an additional 30% on historical datasets! Simply log in, or create a free account to access member discount to combine with the bulk purchase discount.
Discounts for Season Pass Plans
(1) BUNDLE PURCHASE DISCOUNT: Get a bigger discount as you add more season passes to your cart!
• 2 season passes → 5% OFF
• 3 season passes → 10% OFF
• 4 season passes and more → 15% OFF
(2) SUBSCRIBER DISCOUNT: Get an additional 15% on season pass plans! Former season pass holders from any sports qualify for a subscriber discount to combine with bundle purchase discount.
| NCAA Datasets & Plans | View & Download Sample | Price | Buy |
|---|---|---|---|
| CBB Historical Player Stats - 2022-2023 | $25 | ||
| CBB Historical Player Stats - 2023-2024 | $25 | ||
| CBB Historical Team Stats - 2022-2023 | $25 | ||
| CBB Historical Team Stats - 2023-2024 | $25 |
NCAA Men’s Basketball Data In Excel Spreadsheets
NCAA data is built with box scores from each NCAA Men’s basketball game can teach you a lot about how the schools and players performed. To make the most of this information, here is a full guide:
1. Get to know the dataset:
– Box Score: This includes data about each player (points, rebounds, assists, steals, blocks, etc.) and statistics about the team (field goal percentage, free throw percentage, turnovers, etc.).
– Usage Rate and Rest Days: Keep an eye on how tired players are and how their game time is distributed.
– Columns in the Team Dataset:
– Possession: The number of plays a team has used during a game.
– Pace is the speed at which a team plays, based on how many opportunities they get each game.
– Offensive Efficiency is the number of points scored for every 100 possessions
– Defense Efficiency: Points allowed for every 100 possessions.
– Starting Lineups: Know how your team is put together.
– Betting Odds: Opening and ending odds can show what people thought before the game.
2. Look at how the players are doing:
– Usage Rate: Figure out which people are important to the game. High usage rates are often a sign of main offensive players.
– Days of Rest Look at the link between the number of rest days and how well a person does. Being tired can lower your shooting percentage and make you less efficient generally.
3. Measures of team performance:
– Presence and Pace: Check out how the team plays. A fast pace could mean an up-tempo attack.
– Efficiency on offense and defense: Check to see how well a team scores and protects each possession. Look for long-term trends.
– Starting Lineups: Look into how the team does when different combinations of players are used.
4. Strategies to use during the game:
Find players who are involved in important situations (clutch moments, close games) by looking at their usage rate during critical times. Efficiency in Fast Breaks/Transitions: Check how well the team works when things move quickly.
5. “Insights into Betting”
Compare opening and closing betting odds for NCAAB: Keep an eye on how the odds of betting change before and after new information comes out. Find possible bets with high value.
You can also connect CBB betting odds to team or player performance metrics: Check to see if there’s a link between what people thought would happen before the game (the odds) and how they did on the court.
6. Analysis of Statistics:
– Correlation Analysis: Look for links between different factors, like how well a player does and how well the team works together.
– A look at trends: During the season, look for themes and trends.
– Regression Analysis: Use different factors to guess how a team or player will do.
7: “Visualization”
Graphs and charts: Visualizations are a good way to show trends and similarities. Heatmaps let you see how players are doing on the court.
8. Analysis of Each Game:
– Opponent Analysis: Look at how teams and people do when they play different opponents.
– Performance at home and away: Check to see if performance changes a lot or if there’s a home team advantage when it’s done in different venues.
9: Predictive modeling:
– Machine Learning Models: Use past data to make models that can guess how games will turn out.
– Player Injury Impact: Figure out how player problems affect how well the team does.
10. Stay Up-to-Date:
– Updates During the Season: As the season goes on, make sure you keep your research up to date with new data.
– Post-Season Analysis: Look at how well the team and players did in the playoffs.
By using this thorough methods to look at college basketball data, you can learn a lot about how teams and players work together, make smart guesses, and improve your knowledge of the game.

