By default, BigDataBall provides game-by-game logs. In case you’d like to have a season averages table using the logs, follow this walkthrough.
A) Getting the Unique List of Players
A1) We need to transform game-by-game logs to a table that shows season averages of players from the NBA 2019-20 season.
A2) Open your most recent version of the BigDataBall NBA Player in-season dataset.
A3) Copy the entire Player-ID (Column-D) and Player Name (Column-E) columns.
A4) Paste the copied data to a new sheet. You can rename the sheet to Unique or something you like.
A5) Select the columns you copied in the Uniq sheet.
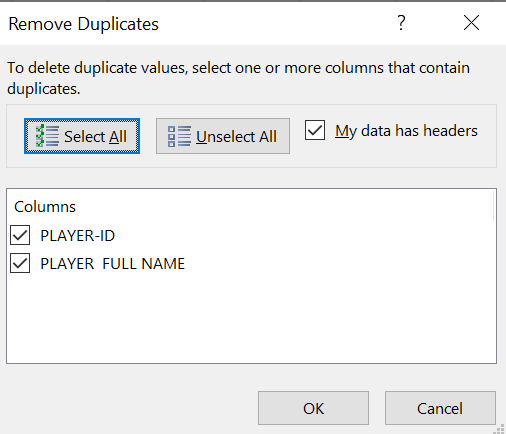
A6) Click DATA tab from the Excel top menu. Find the “Remove Duplicates” button and click OK button.
A7) Now you have the unique list of the players who have played in the season.
B) Calculating Season Averages
B1) Determine the metrics you’d like to calculate averages. IE – MIN/FG/FGA/3P/3PA/FT/FTA/OR/DR/TOT/A/PF/ST/TO/BL/PTS
B2) We will use the powerful SUMIFS formula. As its name suggests, it sums the values from the game-by-game logs if the conditions we set are met.
B3) Input this formula onto the cell C2. I assume you have the first player-ID on the cell A2.
=SUMIFS('GAME-BY-GAME-LOGS'!K:K,'GAME-BY-GAME-LOGS'!$D:$D,$A2)B4) Now, let’s divide the total minutes by games played which can be found with a COUNTIFS formula.
=COUNTIFS('GAME-BY-GAME-LOGS'!$D:$D,$A2)B5) The final formula should appear like this
=SUMIFS('GAME-BY-GAME-LOGS'!K:K,'GAME-BY-GAME-LOGS'!$D:$D,$A2)/COUNTIFS('GAME-BY-GAME-LOGS'!$D:$D,$A2)B6) When you drag the formula to the right horizontally you will get Jrue Holiday’s season averages. To get all players averages drag it to the bottom vertically.
That’s it, you now have a season averages table!